Tuesday 11 October 2022

The 52 Hillforts of Wiltshire


Rybury Camp - Tim Daw

My list of the 52 Hillforts of Wiltshire. 

I visited them all in 2022 - some aren't accessible so I went as close as I could legally and safely. But where I could I walked within each one.

Thoroughly enjoyable way to visit the whole of Wiltshire and experience some wonderful places and views - I recommend doing it thoroughly.


Name

Longitude

Latitude

1

Castle Hill, Blunsdon St Andrew

-1.77441

51.61914

2

Bury Hill Camp, Purton

-1.9183

51.60967

3

Nuns Walk, Malmesbury.

-2.09482

51.58369

4

Ringsbury Camp

-1.89333

51.57961

5

Liddington Castle

-1.70066

51.51583

6

Bincknoll Castle

-1.84618

51.51221

7

Barbury Castle

-1.78635

51.48527

8

Membury Camp

-1.56636

51.47567

9

Bury Wood Camp

-2.2632

51.46427

10

Nash Hill

-2.09702

51.42346

11

Oldbury Castle

-1.93037

51.42246

12

Chisbury Camp

-1.60051

51.39205

13

Oliver's Castle

-1.99994

51.38113

14

Rybury Camp

-1.88173

51.37463

15

Martinsell Hill Camp

-1.7514

51.37447

16

Giant's Grave

-1.76244

51.36796

17

Budbury

-2.25754

51.34854

18

Godsbury

-1.68904

51.31853

19

Fosbury Camp

-1.54311

51.30692

20

Broadbury Banks

-1.86838

51.29888

21

Castle Combe

-2.14601

51.29561

22

Sunton

-1.65939

51.28765

23

Chisenbury Camp

-1.78358

51.28374

24

Casterley Camp

-1.83531

51.28101

25

Bratton Castle

-2.14302

51.26376

26

Sidbury Camp

-1.6913

51.25365

27

Battlesbury Camp

-2.14668

51.20994

28

Cley Hill Camp

-2.23204

51.20298

29

Scratchbury Camp

-2.1262

51.19727

30

Knook Castle

-2.05856

51.19553

31

Vespasian's Camp

-1.79108

51.17399

32

Codford Circle

-2.02644

51.16419

33

Yarnbury Castle

-1.95097

51.16271

34

Ludgershall Castle

-1.37222

51.15252

35

Ogbury Camp

-1.79669

51.14368

36

Bilbury Rings

-1.98711

51.12541

37

Grovely Castle

-1.93238

51.12132

38

Ebsbury Hill

-1.91339

51.11762

39

Park Hill Camp

-2.33901

51.11122

40

White Sheet Castle

-2.28097

51.11032

41

Figsbury Ring

-1.73232

51.10337

42

Kenwalch's Castle

-2.36163

51.10056

43

Old Sarum

-1.80464

51.09337

44

Wick Ball Camp

-2.00071

51.08687

45

Castle Ditches, Tisbury

-2.0533

51.05463

46

Chiselbury

-1.97559

51.05239

47

Great Woodbury

-1.79653

51.04969

48

Odstock Copse

-1.79517

51.02569

49

Castle Rings, Donhead St Mary

-2.16153

51.02501

50

Clearbury Ring

-1.78401

51.01836

51

Winklebury Camp

-2.06945

50.99478

52

The Earldoms

-1.64684

50.99299

 Listed North to South

Information from The Oxford Atlas of Hillforts of Britain and Ireland: Lock, G. and Ralston, I. 2017. which includes much more information about each Hillfort.
Ordnance Survey and Google Street View to preview parking also highly recommended.

(Castle Combe and Ludgershall added as there is enough evidence for them be classed as Hillforts)
Atlas of Hillforts of Britain and Ireland. Available at: https://hillforts.arch.ox.ac.uk Creative Commons License
This work is licensed under a Creative Commons Attribution-ShareAlike 4.0 International License.


Saturday 8 October 2022

Strontium Values Reappraisal - The South-West not Scotland?

That pigs, cattle, humans and even a dog came to the Stonehenge area from distant parts in prehistory has been one of the more interesting scientific discoveries of recent times. The links to Orcadian culture has also been speculated on. 

Behind the headlines and speculation there is solid research - some links to start from:

Evans, J., Parker Pearson, M., Madgwick, R. et al. Strontium and oxygen isotope evidence for the origin and movement of cattle at Late Neolithic Durrington Walls, UK. Archaeol Anthropol Sci 11, 5181–5197 (2019). https://doi.org/10.1007/s12520-019-00849-w 

Snoeck, C., Pouncett, J., Claeys, P. et al. Strontium isotope analysis on cremated human remains from Stonehenge support links with west Wales. Sci Rep 8, 10790 (2018). https://doi.org/10.1038/s41598-018-28969-8 

The interpretations of Strontium and other isotope analysis lead to controversy. 

Gordon J. Barclay & Kenneth Brophy (2020): ‘A veritable chauvinism of prehistory’: nationalist prehistories and the ‘British’ late Neolithic mythos, Archaeological Journal, DOI: 10.1080/00665983.2020.1769399

Richard Madgwick, Angela Lamb, Hilary Sloane, Alexandra Nederbragt, Umberto Albarella, Mike Parker Pearson & Jane Evans (2021) A veritable confusion: use and abuse of isotope analysis in archaeology, Archaeological Journal, 178:2, 361-385, DOI: 10.1080/00665983.2021.1911099

The ‘omphalos of Britain’: iconic sites and landscapes, methodological nationalism and conceptual conservatism in the writing of ‘British’ prehistory. A reply to Madgwick and collaborators 2021 Gordon J. Barclay and Kenneth Brophy DOI: 10.6084/m9.figshare.17296994

So a reappraisal is warranted: The high strontium levels that have been taken to indicate movement from Scotland might now indicate the South-West instead.  A recent paper:

Müldner, Gundula & Frémondeau, Delphine & Evans, Jane & Jordan, Alexis & Rippon, Steven. (2022). Putting South-West England on the (strontium isotope) map: A possible origin for highly radiogenic 87Sr/86Sr values from southern Britain. Journal of Archaeological Science. 144. 105628. 10.1016/j.jas.2022.105628.

"Reconstructions of ancient mobility based on strontium isotopes are only ever as reliable as estimates for baseline values of bioavailable strontium in the study area. Current biosphere mapping for Britain suggests that there are no sizeable areas hosting 87Sr/86Sr values above 0.714 south of Cumbria. As a result, archaeological humans or animals with such (for Britain) ‘highly radiogenic’ strontium isotope values are commonly interpreted as having moved either from Scotland or abroad. This paper presents the first dedicated strontium isotope map for South-West England based on 98 modern biosphere samples (including 68 new measurements). Numerous samples from the Cornubian granite (Dartmoor) have 87Sr/86Sr values above 0.714 (maximum 0.7287) and, based on their distribution, it is suggested that the previously elusive ‘highly radiogenic’ values are characteristic for areas where the soil has with high rubidium concentrations. These occur at lower elevations which are better suited for agriculture and permanent human settlement than the high moors. Previous interpretations of archaeological samples from southern Britain may need to be revised considering these new results, but they also highlight the continued need for biosphere sampling and the usefulness of geochemical maps as a routine part of strontium isotope investigations in archaeology."


Sunday 2 October 2022

The latest scientific consensus on Stonehenge and Glacial Transport - there is no evidence of a link

There seems to be some confusion as to what the latest scientific consensus by the relevant experts in glaciation is with regards to Stonehenge.

TL;DR summary:  They acknowledge their models aren't quite working with how far the ice spread out into the Celtic sea, but when they tweak the current model to correct that it brings ice down into the south west of England where there is no evidence for it apart from a hypothesis of glacial erratics at or on their way to Stonehenge. They prefer the hypothesis that they are missing an input in their model and if that was corrected the model would match the reality better, which doesn't include glaciers in the south west of England.   


Maximum Glaciation

The relevant paragraph:

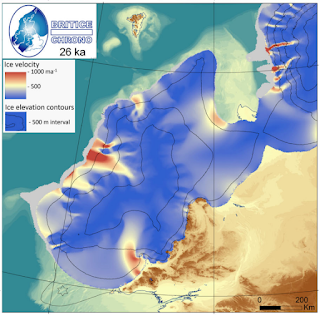
An egregious mismatch occurred at 26 ka, where the modelled grounding line position of the Irish Sea Ice Stream fell 150 km behind that indicated by the geological evidence (minimum reconstruction, Fig. 6; Scourse et al. 2021). We experimented with various nudges to the model to try and prevent this underrun but they resulted in significant overruns of other parts of the ice sheet, notably with the SW Peninsula of England (Cornwall and Devon) and much of the English Midlands becoming glaciated. The final choice of model run (Fig. 6) is therefore a compromise that mostly fits the wider empirical limits, but underruns in the Celtic Sea. The alternative choice of accepting a model run that reached the shelf edge in the Celtic Sea but also glaciated the SW Peninsula and parts of the English Midlands would have interesting implications for the long-standing hypothesis that some of the stones of Stonehenge may have been transported, at least partway as glacial erratics (e.g. Judd 1902; Scourse 1997; John 2018; Pearson et al. 2019). Although this may indeed be accommodated by earlier more extensive glaciations, we suggest however, that a process, forcing, or feedback is missing in the numerical modelling we present here and that once discovered would enable sufficient ice advance in the Celtic Sea without exceeding ice limits elsewhere. For example, Scourse et al. (2021) suggest that a non-steady oscillation (surge) arose as a release from the build-up of ice behind a topographic constriction in the Irish Sea. We further speculate that the drainage of lakes on the ice stream surface, or floods from subglacial lakes, may have temporarily facilitated faster ice flow and ‘over-extension’ of the ice margin by locally increasing basal lubrication. 


From:

https://onlinelibrary.wiley.com/share/T7PBKPTRFPBVRJJCXSJU?target=10.1111/bor.12594

Clark, C.D., Ely, J.C., Hindmarsh, R.C.A., Bradley, S., Ignéczi, A., Fabel, D., Ó Cofaigh, C., Chiverrell, R.C., Scourse, J., Benetti, S., Bradwell, T., Evans, D.J.A., Roberts, D.H., Burke, M., Callard, S.L., Medialdea, A., Saher, M., Small, D., Smedley, R.K., Gasson, E., Gregoire, L., Gandy, N., Hughes, A.L.C., Ballantyne, C., Bateman, M.D., Bigg, G.R., Doole, J., Dove, D., Duller, G.A.T., Jenkins, G.T.H., Livingstone, S.L., McCarron, S., Moreton, S., Pollard, D., Praeg, D., Sejrup, H.P., Van Landeghem, K.J.J. and Wilson, P. (2022), Growth and retreat of the last British–Irish Ice Sheet, 31 000 to 15 000 years ago: the BRITICE-CHRONO reconstruction. Boreas. https://doi.org/10.1111/bor.12594